MACD Divergence Strategy
MACD (Moving Average Convergence Divergence) is a very popular trading indicator. It is in essence a trend following indicator that shows the relationship between two moving averages. The most used settings are the 12 period exponential moving average (EMA) and the 26 period EMA. The MACD value is calculated by subtracting the 26 EMA from the 12 EMA.
You can use other values, however for the purposes of the MACD divergence strategy we use these work pretty well.
The most obvious strategy using MACD is when the 12 EMA crosses the 26 EMA, however this is really just a moving average cross over strategy you could do from the chart. Moving average crossover strategies are also not good strategies by themselves unless you are lucky enough to catch the beginning of a major trend.
We prefer to use the MACD divergence strategy to help us find opportunities where the security is overbought or over sold. We have found over the years that MACD divergence is fairly accurate in predicting a rebound or pull back before you see it in the price action.
This is NOT to say it is a perfect signal. Eventually it is usually correct but there can be a consolidation period which normalizes the MACD and then the security continues to move in the original direction. You have to use the price action on the chart to determine entry and exit points after you see a potential MACD divergence forming. Watch out for consolidation and be sure to take your profits. This strategy is used to signal a pull back or rebound not a change in trend direction.
When we talk about MACD divergence we do not mean that the MACD is still going up and the stock price is going down. People do what for this type of divergence but that is not the type of MACD divergence we like to use as a potential trade entry indicator.
We look at two types of MACD divergence.
One is when the stock prices are making new highs and the MACD histogram is not showing new highs. The opposite would the stock prices are making new lows and the MACD histogram is not showing new lows.
The second type is just like the one above but we use the faster EMA (12 EMA if using default settings) instead of the histogram. Other than that it works the same. We use the EMA divergence more than the histogram MACD divergence.
Below is an example of the type of MACD divergence we look for.
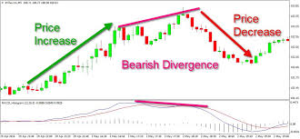
Again, after we notice the MACD divergence we wait for an entry based on price action, trend lines or candle sticks. We also not afraid to take profits and move our stops down.
If you like this, take a look at our books below for more trading tips.